Logs play a crucial role in our daily work as a software developers. They are the primary source for understanding what’s happening under the hood and for spotting issues. However, managing logs can be a challenging task, especially in complex systems with many components.
As a Java developer, the ELK stack has often been the go-to choice for centralized log management. It’s popular in the community, and there are customizable libraries that make it easy to integrate. If you blindly choose ELK, you will probably be sitisfied. Elasticsearch, a key part of the ELK stack, offers powerful full-text search capabilities through content indexing.
While this sounds great, it comes with a trade-off. Elasticsearch tends to consume more resources due to its comprehensive indexing and more complex querying features.
Because of these concerns, I decided to explore Grafana Loki. Loki is designed to be more resource-efficient by minimizing indexing.
Prerequirements
- minikube / kubernetes cluster
- helm
Set-up grafana helm chart
To get started with Grafana Loki, I chose to use a Minikube environment along with Helm, the package manager for Kubernetes. Helm simplifies the configuration of distributed systems, making it easier to manage complex setups. I could have opted for a simpler approach, like using plain Docker or working directly on a virtual machine, but I was keen to explore this within a Kubernetes cluster.
helm repo add grafana https://grafana.github.io/helm-charts
After adding repository, I had to update my local Helm repository cache to ensure there was the latest versions of the charts.
helm repo update
Next, I wanted to review the default configuration values for the Loki stack. This command exports the default settings into a file that I could edit to customize the deployment. This step was necessary in my case.
helm show values grafana/loki-stack > loki.yaml
With the loki.yaml file ready for editing, I made modifications to tailor the configuration to my needs. Here’s an example of the adjustments I made:
---
loki:
  enabled: true
  isDefault: true
  url: http://{{(include "loki.serviceName" .)}}:{{ .Values.loki.service.port }}
  readinessProbe:
    httpGet:
      path: /ready
      port: http-metrics
    initialDelaySeconds: 45
  livenessProbe:
    httpGet:
      path: /ready
      port: http-metrics
    initialDelaySeconds: 45
  datasource:
    jsonData: "{}"
    uid: ""

promtail:
  enabled: true # {1}
  config:
    logLevel: info
    serverPort: 3101
    clients:
      - url: http://{{ .Release.Name }}:3100/loki/api/v1/push
    snippets: # {3}
      pipelineStages:
        - json:
            expressions:
              log: log
              stream: stream
              time: time
        - json:
            source: log
            expressions:
              ip: ip
              level: level
              method: method
              msg: msg
              route: route
              inner_time: time
        - labels:
            route:
            method:
            msg:
            level:

grafana:
  enabled: true # {2}
  sidecar:
    datasources:
      label: ""
      labelValue: ""
      enabled: true
      maxLines: 1000
  image:
    tag: latest
The key part of the configuration is ensuring that Promtail {1} and Grafana are enabled {2}. I also added settings {3} to extract data from JSON logs to include additional labels such as level, method, and msg. This configuration part was totaly optional and tailored to sample app, which will be created in next step.
Finally, it was a good time to apply changes and install grafana/loki-stack
helm upgrade --install --values loki.yaml loki grafana/loki-stack -n loki-playground --create-namespace
After running this command, I received confirmation that Loki was deployed and ready to use.
Set-up sample application
To demonstrate how logs are collected and queried, I prepared a sample application written in Go. This section provides a basic overview of the necessary files to run the application.
main.go
package main

import (
	"fmt"
	"net/http"
	"os"

	"github.com/sirupsen/logrus"
)

var log = logrus.New()

func main() {
	log.SetFormatter(&logrus.JSONFormatter{})
	log.SetOutput(os.Stdout)

	http.HandleFunc("/status", func(w http.ResponseWriter, r *http.Request) {
		log.WithFields(logrus.Fields{
			"method": r.Method,
			"route":  r.URL.Path,
			"ip":     r.RemoteAddr,
		}).Info("Health check endpoint hit")

		w.WriteHeader(http.StatusOK)
		fmt.Fprintf(w, "OK")
	})

	log.Info("starting server on :8080")
	if err := http.ListenAndServe(":8080", nil); err != nil {
		log.Fatalf("Error starting server: %v", err)
	}
}
Dockerfile
FROM golang:1.22 as builder
WORKDIR /app
COPY go.mod go.sum ./
RUN go mod download
COPY . .
RUN CGO_ENABLED=0 GOOS=linux go build -o /golang-app

FROM alpine:latest
WORKDIR /root/
COPY --from=builder /golang-app .
EXPOSE 8080
CMD ["./golang-app"]
deployment.yaml
apiVersion: apps/v1
kind: Deployment
metadata:
  name: golang-app
  labels:
    app: golang-app
spec:
  replicas: 2
  selector:
    matchLabels:
      app: golang-app
  template:
    metadata:
      labels:
        app: golang-app
    spec:
      containers:
        - name: golang-app
          image: dj/golang-app:latest
          imagePullPolicy: Never
          ports:
            - containerPort: 8080
          env:
            - name: LOG_LEVEL
              value: "info"
service.yaml
apiVersion: v1
kind: Service
metadata:
  name: golang-app-service
spec:
  selector:
    app: golang-app
  ports:
    - protocol: TCP
      port: 8080
      targetPort: 8080
  type: NodePort
With these files in place, I deployed the golang-app to my Kubernetes cluster by running the following commands:
docker build -t dj/golang-app:latest .
kubectl apply -f deployment.yaml
kubectl apply -f service.yaml
If you’re unfamiliar with these commands, I highly recommend learning the basics of Docker and Kubernetes.
To check the status of your deployment, use
kubectl get all -n default
Loki
With everything up and running in my Minikube environment, I just needed to make one final tweak to access the Grafana dashboard. Instead of going the NodePort route, I opted to set up port-forwarding with the following command:
kubectl port-forward pod/loki-grafana-b86d8579f-76tr9 9090:3000 -n loki-playground # {1}
To get the exact name of the Grafana pod, I used kubectl get pod -n loki-playground and noted it down.
Next up was grabbing the generated password for Grafana. A quick command did the trick:
kubectl get secret --namespace loki-playground loki-grafana -o jsonpath="{.data.admin-password}" | base64 --decode ; echo
And just like that, I could now access Grafana at http://localhost:9090.
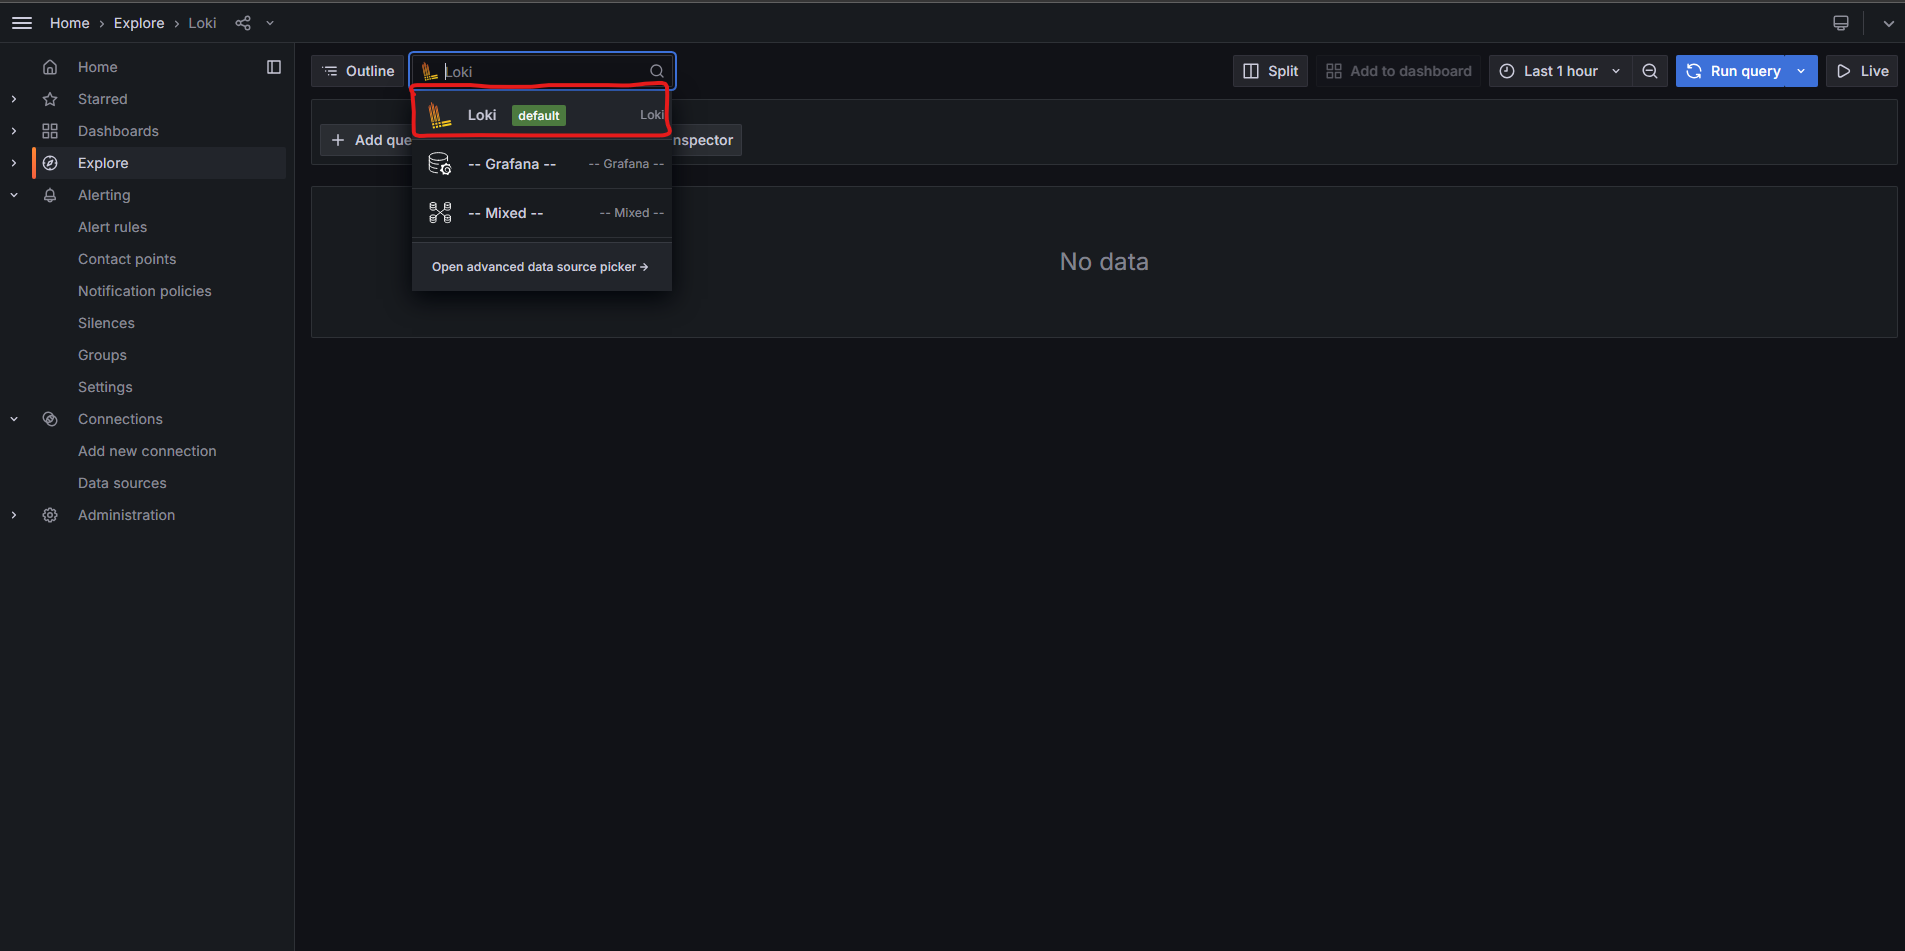
With the setup complete, I headed over to the “Explore” section in Grafana and selected “Loki (default)” to start searching through logs.

Everything seemed ready to go, but when I filtered by the app=golang-app label, I realized there were no logs yet. Time to fix that!
Since the Golang app is running in the default namespace and exposed via a NodePort service, I needed to get the Minikube IP and the NodePort for the app. Once I had those, I could send a request to the app.
minikube ip # {1}
kubectl get svc -n default # {2}
After noting down the Minikube IP {1} and NodePort {2}, I sent a GET request using:
curl http://<minikube-ip>:<nodeport>/status
In my case it was curl http://192.168.49.2:30641/status
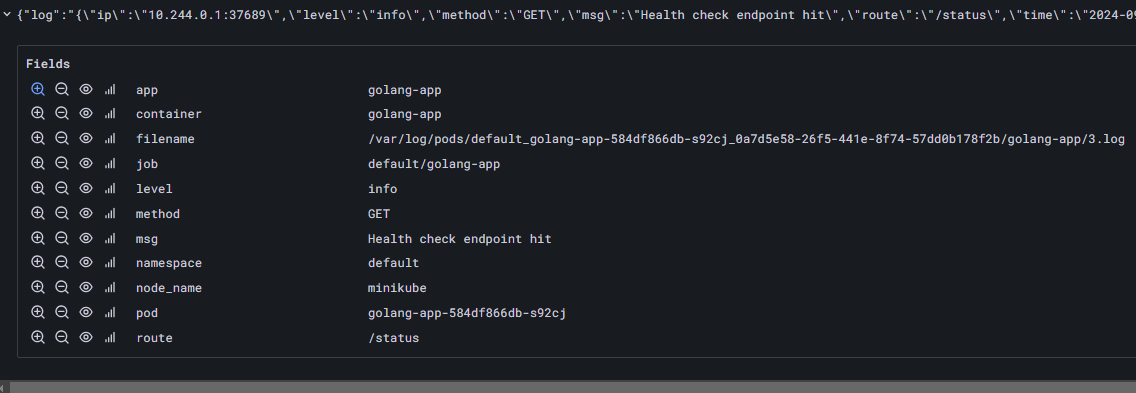
And voilà, the first logs started rolling in!

Summary
Configuring Loki turned out to be a relatively straightforward process, thanks to the Helm charts. After a few necessary adjustments, like enabling Grafana and setting up log parsing for JSON, everything fell into place quite smoothly.
While it’s easy to get Loki up and running, mastering its more advanced configuration options, such as pipeline stages and understanding the full scope of its configuration settings, can be challenging.
In conclusion, Loki feels like a tool that’s really built for log aggregation, unlike Elasticsearch, which is an engine designed for advanced searching. This makes Loki a solid choice if you’re specifically focused on managing logs. Definitely worth trying!

Comments